Make Data-Driven Decisions 📊
In today's competitive e-commerce landscape, running a successful online store requires more than just great products. You need to understand your customers, track your performance, and make informed decisions based on real data. Trinavo's Analytics Dashboard puts all the insights you need at your fingertips, helping you transform raw data into actionable business intelligence.
Whether you're tracking daily sales, understanding customer behavior, or identifying your best-performing products, our analytics tools give you a clear picture of your store's health. No more guessing or relying on intuition alone—let the numbers guide your strategy and watch your business grow.
Sales Analytics
Understanding your sales performance is fundamental to growing your e-commerce business. Trinavo's sales analytics provide you with a comprehensive view of your revenue streams and help you identify trends, opportunities, and areas that need attention.
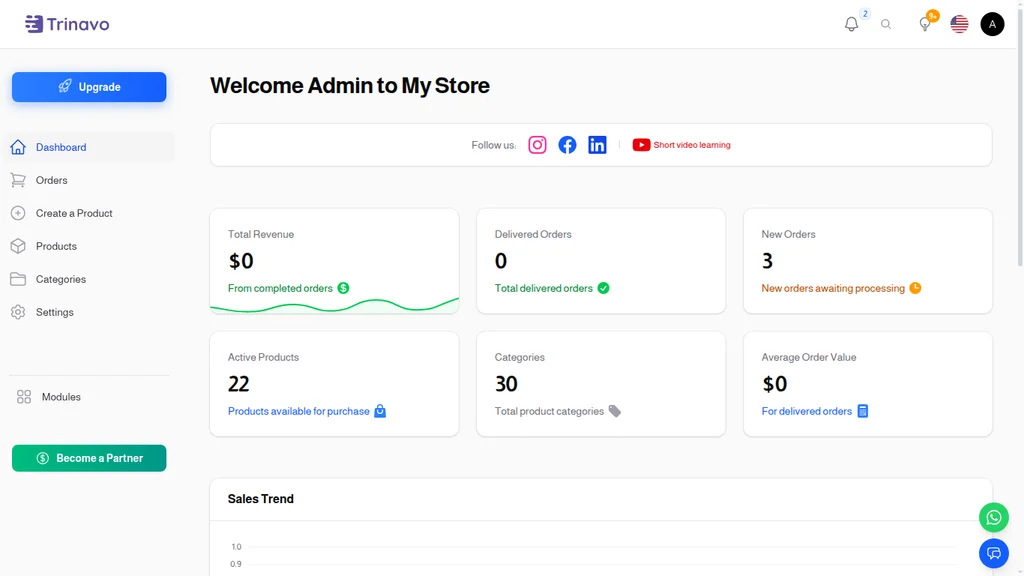
Real-Time Revenue Tracking
Monitor your sales as they happen. The dashboard displays your current day's revenue, number of orders, and average order value in real-time. This immediate feedback allows you to react quickly to trends—whether it's a sudden spike from a marketing campaign or an unexpected slowdown that needs investigation.
Period Comparisons
Compare your performance across different time periods to understand your growth trajectory. View daily, weekly, monthly, and yearly comparisons side by side. See how this month compares to last month, or how your current quarter stacks up against the same period last year. These comparisons help you identify seasonal patterns and measure the impact of your business decisions.
Key Metrics at a Glance
- Total Revenue: Track your gross and net sales with automatic tax calculations
- Order Count: Monitor the number of orders processed
- Average Order Value (AOV): Understand how much customers spend per transaction
- Conversion Rate: See what percentage of visitors become paying customers
- Items Per Order: Track the average number of products in each order
Product Performance
Identify your best sellers and underperformers. The product performance section shows you which items generate the most revenue, which have the highest margins, and which might need promotional support. Use this data to optimize your inventory investment and marketing focus.
Customer Insights 👥
Your customers are the lifeblood of your business. Understanding who they are, how they behave, and what motivates their purchases is essential for long-term success. Trinavo's customer analytics help you build deeper relationships and improve customer satisfaction.
Customer Segments
Not all customers are the same. Our analytics help you identify different customer segments based on their purchasing behavior. Discover your VIP customers who make frequent high-value purchases, identify first-time buyers who might need nurturing, and recognize at-risk customers who haven't purchased in a while.
Purchase Behavior Analysis
Understand how your customers shop. See what products are frequently bought together, which categories attract the most interest, and what times of day or week generate the most activity. This behavioral data helps you optimize everything from product placement to email timing.
Customer Lifetime Value
Track the long-term value of your customer relationships. Customer Lifetime Value (CLV) metrics help you understand how much a typical customer is worth over time, allowing you to make smarter decisions about customer acquisition costs and retention investments.
New vs. Returning Customers
A healthy business needs both new customers and loyal repeat buyers. Monitor your ratio of new to returning customers over time. If you're acquiring lots of new customers but few return, you might have a retention problem. If you're relying heavily on repeat customers but not attracting new ones, growth could stall.
Geographic Distribution
See where your customers are located. Geographic data helps you understand which markets are performing well and identify expansion opportunities. This information is also valuable for optimizing shipping strategies and planning localized marketing campaigns.
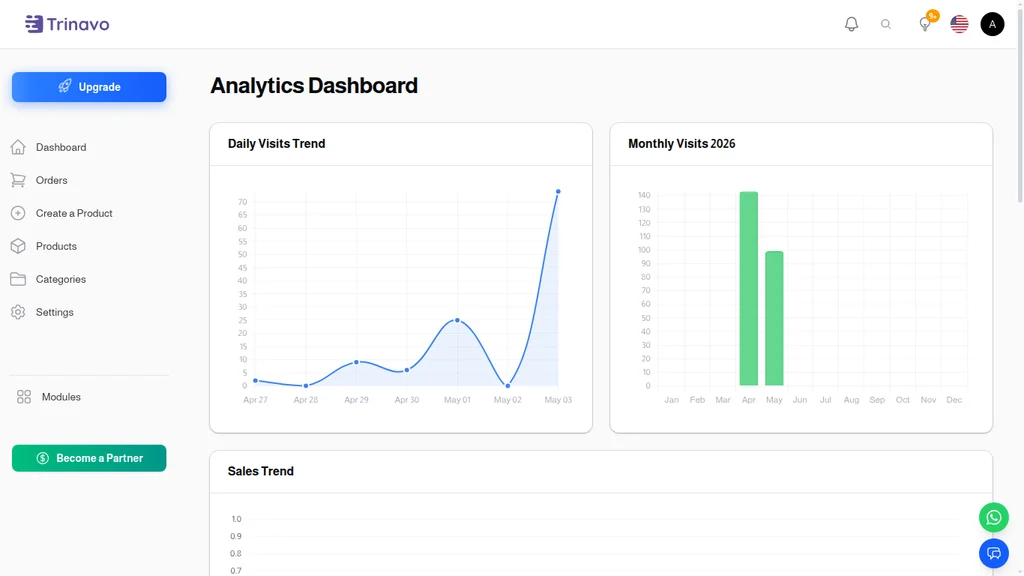
Traffic Analysis
Before customers buy, they visit. Understanding your traffic sources and visitor behavior helps you optimize your marketing spend and improve the shopping experience.
Traffic Sources
Know where your visitors come from. The traffic breakdown shows you what percentage of visits come from:
- Direct Traffic: Visitors who type your URL directly
- Organic Search: People who find you through search engines
- Paid Search: Traffic from your advertising campaigns
- Social Media: Visitors from social platforms
- Referrals: Traffic from other websites linking to you
- Email: Visitors from your email marketing campaigns
Visitor Behavior
Track how visitors interact with your store. See which pages they visit most, where they spend the most time, and where they tend to drop off. High bounce rates on certain pages might indicate problems with content or user experience that need addressing.
Search Analysis
If your store has a search function, analytics show you what terms customers are searching for. This valuable data reveals what products customers expect to find, helping you identify gaps in your inventory or opportunities for better product organization.
Device and Browser Data
Understand what devices and browsers your customers use. If a significant portion of your traffic comes from mobile devices but your mobile conversion rate is low, you might need to improve your mobile shopping experience.
Reports and Exports 📈
Data is only valuable if you can act on it. Trinavo provides flexible reporting tools that let you dig deeper into your analytics and share insights with your team.
Pre-Built Reports
Access common reports with a single click. Pre-built reports cover essential metrics like daily sales summaries, monthly performance overviews, product performance rankings, and customer acquisition reports. These reports are designed to answer the most common questions store owners have.
Custom Date Ranges
Analyze any period you choose. Whether you want to see last week's performance, compare two specific months, or review an entire year, flexible date selection makes it easy to get the data you need.
Export Options
Download your data for further analysis or record-keeping. Export reports in multiple formats:
- CSV: For importing into spreadsheets or other tools
- PDF: For professional reports and presentations
- Excel: For advanced analysis with formatting preserved
Share with Your Team
Collaborate effectively by sharing reports with team members, accountants, or business partners. Grant appropriate access levels so everyone has the information they need without exposing sensitive data.
Dashboard Features
The analytics dashboard is designed to make data accessible and actionable, even if you're not a data analyst.
Real-Time Updates
Your dashboard updates automatically, showing you the latest data without needing to refresh. Watch your metrics change throughout the day as new orders come in and visitors browse your store.
Customizable Layout
Arrange your dashboard to show what matters most to you. Pin your most important metrics to the top, hide sections you don't need, and create a personalized view that matches your workflow.
Mobile Responsive
Check your analytics from anywhere. The dashboard is fully responsive, giving you access to your key metrics whether you're at your desk or on the go.
Quick Actions
Turn insights into action directly from the dashboard. See a product performing well? Add it to a promotion. Notice a customer segment that needs attention? Launch a targeted email campaign. The dashboard connects analytics to action.
Start Growing with Data
Every successful e-commerce business is built on a foundation of understanding. With Trinavo's Analytics Dashboard, you have the tools to understand your customers, track your performance, and make decisions that drive growth. Stop guessing and start knowing—your data is waiting to tell you the story of your business.