Reports
Purpose
The Reports page provides comprehensive business intelligence tools to analyze your store's performance across multiple dimensions. Generate detailed reports on sales, financials, user activity, and inventory, with the ability to export data in Excel or PDF formats for further analysis and record-keeping.
Accessing Reports
Navigate to: Reports > Reports from the sidebar menu
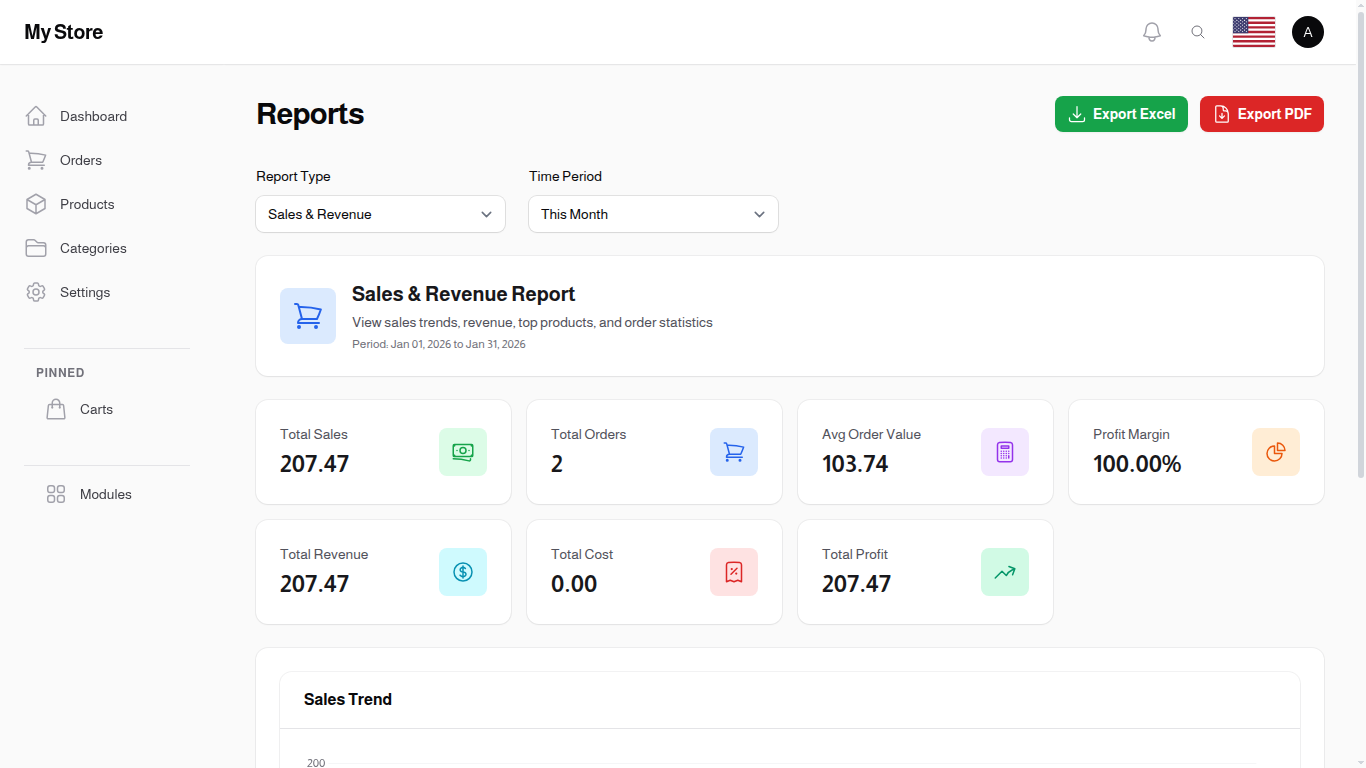
The Reports page showing available report types and export options
Report Controls
At the top of the Reports page, you'll find filters to customize your report view:
Report Type
Select the type of report you want to generate:
- Sales & Revenue: Sales trends, revenue, top products, and order statistics
- Financial: Sales, cost, expenses and your real profit
- User Analytics: User registrations, activity, loyalty points, and customer behavior
- Inventory: Stock levels, product performance, and inventory value
Time Period
Filter report data by selecting a date range:
Available Time Periods: - Today: Current day's data - Yesterday: Previous day's complete data - This Week: Current week from Sunday to today - Last Week: Complete data from the previous week - This Month: Current month from the 1st to today - Last Month: Complete data from the previous month - Last 7 Days: Rolling 7-day window - Last 30 Days: Rolling 30-day window - Custom Range: Select your own start and end dates
When you select "Custom Range", two additional date picker fields appear to set the start and end dates.
Sales & Revenue Report
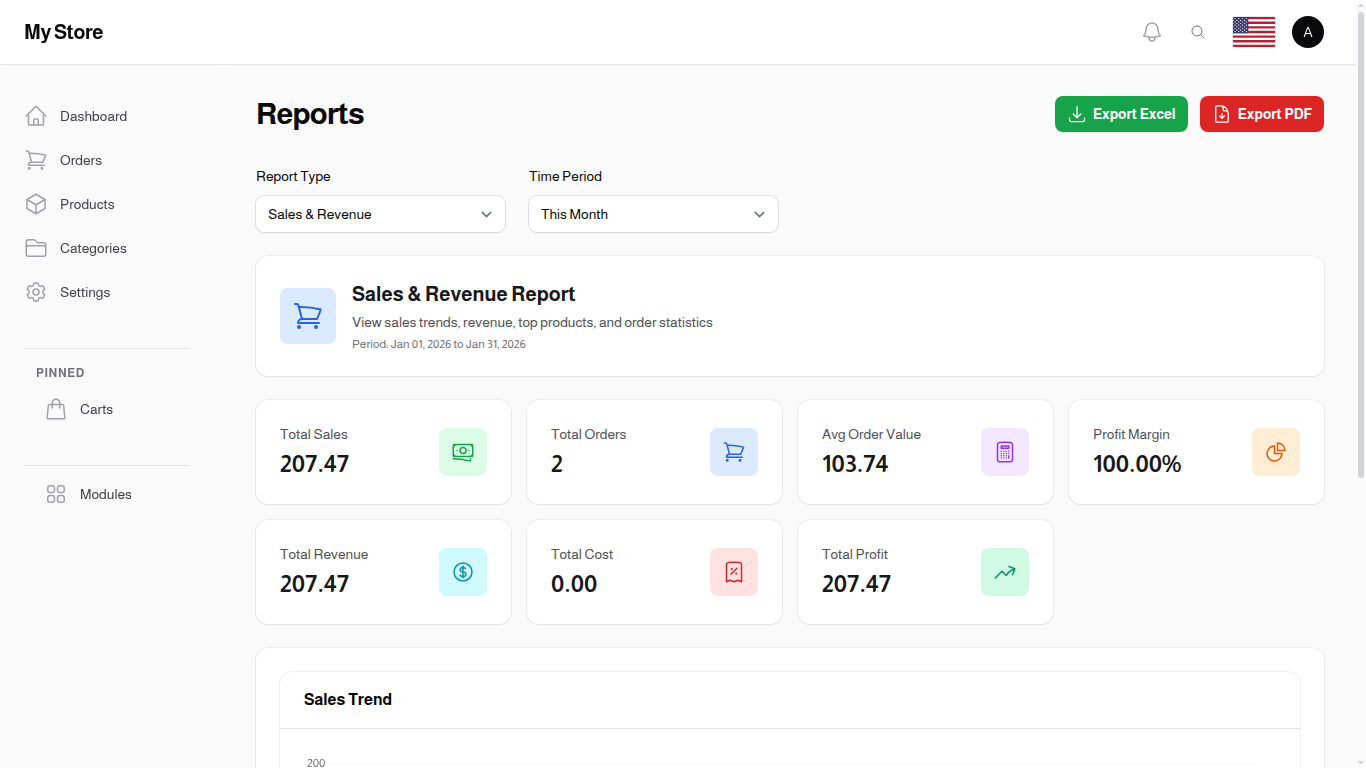
Sales & Revenue Report showing order trends and top-performing products
The Sales & Revenue Report provides insights into your store's sales performance:
Key Metrics: - Total Orders: Number of orders placed during the period - Total Revenue: Sum of all order values - Average Order Value: Mean value per order - Order Status Breakdown: Distribution of orders by status (pending, completed, cancelled, etc.)
Top Products: - List of best-selling products by quantity - Revenue generated by each product - Number of orders containing each product
Sales Trends: - Daily/weekly/monthly sales charts - Revenue growth trends - Order volume patterns
Payment Methods: - Breakdown of orders by payment method - Revenue distribution across payment methods
Financial Report
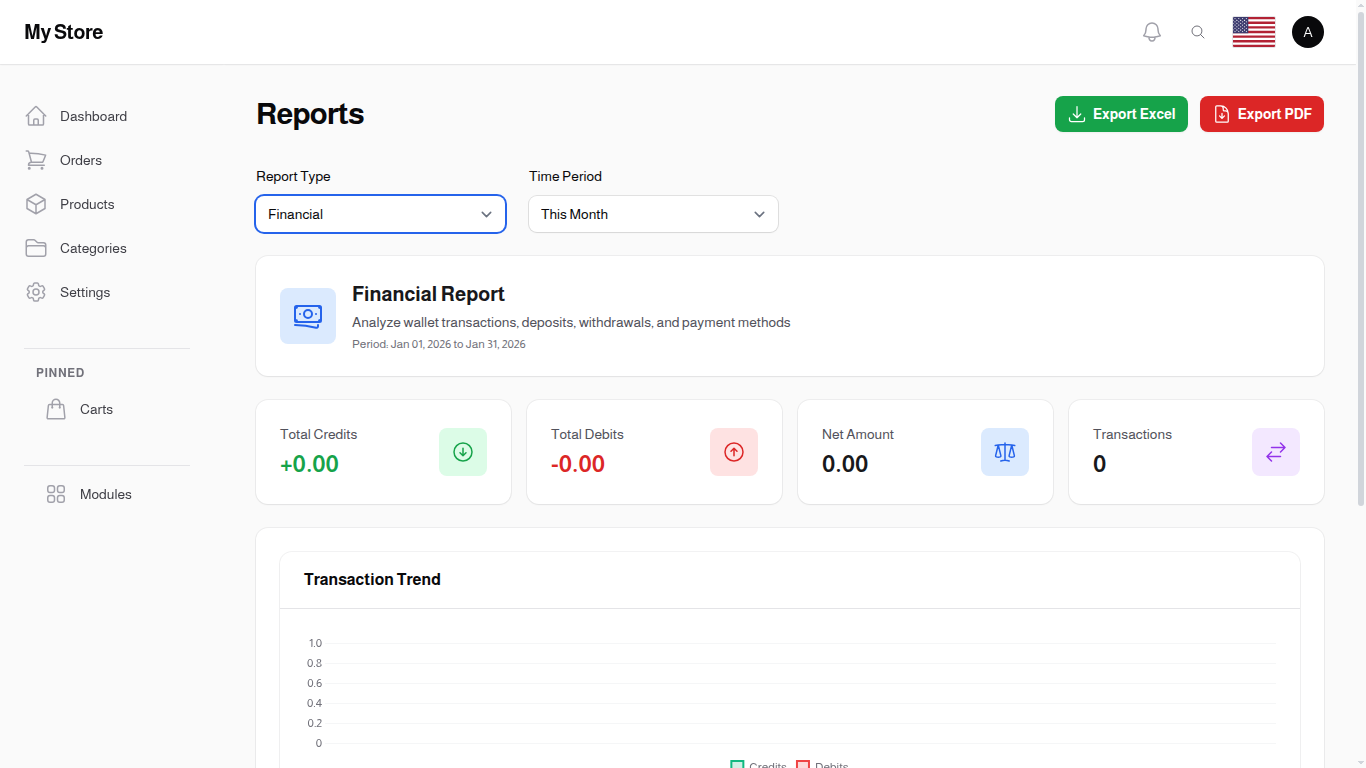
Financial Report showing the whole way from sales down to your real profit
The Financial Report takes you from what you sold to what you actually kept:
Your sales: - Gross Sales: everything you sold, including orders you later refunded - Refunds: what you gave back, and how many orders that was - Net Sales: what is left after refunds
Your profit: - Cost: what the products you sold cost you - Gross Profit: Net Sales minus Cost. This is the profit on your products only, before the cost of running the shop - Operating Expenses: what you recorded under Expenses for this period - Net Profit: Gross Profit minus Operating Expenses. This is the real number - Expenses by Category: where the money went
For information only (these are never subtracted from your profit): - Stock bought this period: what you paid suppliers for stock. It is not subtracted here because stock becomes a cost at the moment you sell it, and it is already counted under Cost - Delivery charged to customers: already counted in your sales. What you paid the delivery company is a separate thing, and you record it under Expenses - Stock written off: damaged, lost or expired stock recorded in this period
If some products were sold without a cost, the report shows a warning that your profit is overstated. A product with no cost recorded looks like it was free, which makes the profit on it look like 100%. Setting a cost on your products clears the warning.
Payment Method Statistics: - Usage frequency by payment method - Revenue processed through each method
User Analytics Report
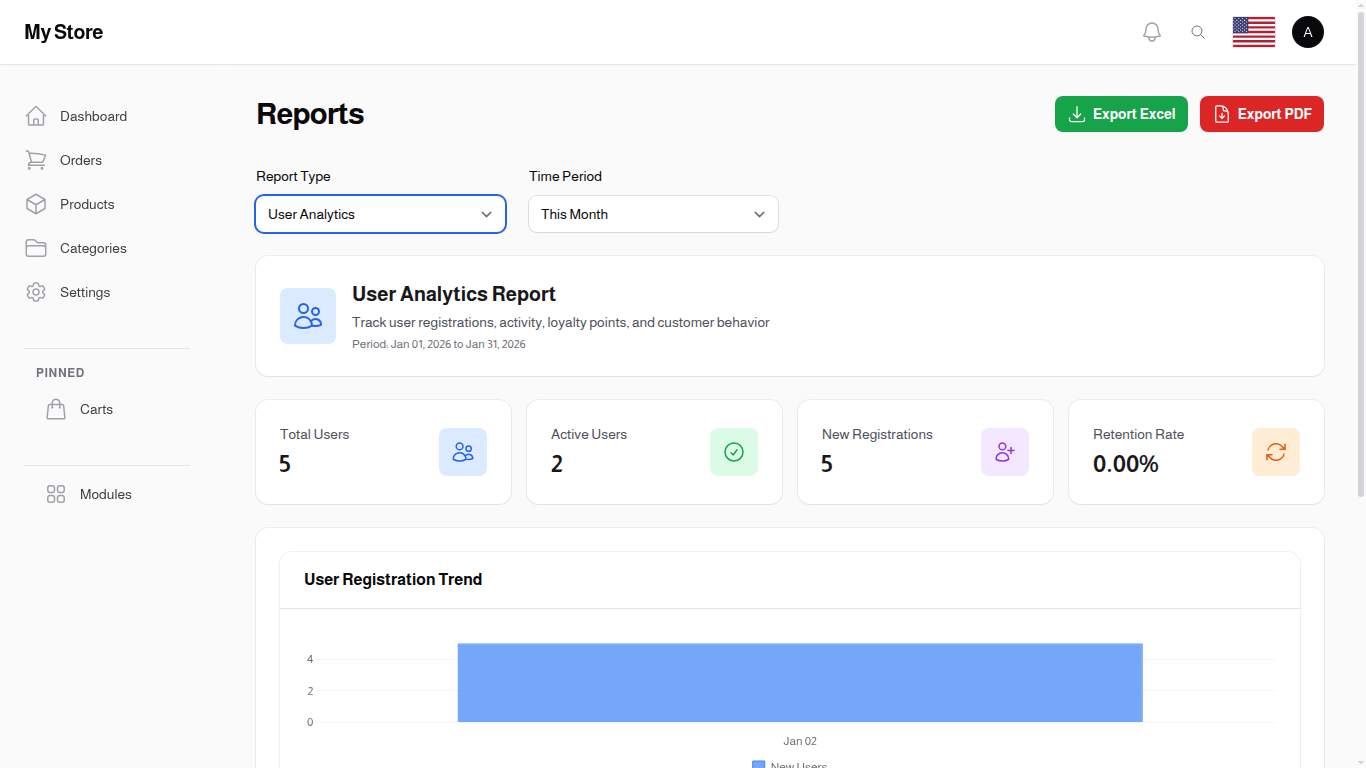
User Analytics Report showing registration trends and activity metrics
The User Analytics Report tracks customer engagement and behavior:
User Growth: - New Registrations: Number of new users registered - Total Active Users: Users who placed orders or interacted with the store - User Roles Distribution: Breakdown by customer, vendor, etc.
User Activity: - Total Orders per User: Average number of orders - Customer Lifetime Value: Average revenue per customer - Repeat Customer Rate: Percentage of returning customers
Loyalty Program Metrics: - Points Earned: Total loyalty points awarded - Points Redeemed: Points used by customers - Active Loyalty Members: Users participating in the loyalty program - User Level Distribution: Distribution across user levels
User Behavior: - Most active customers - Customer retention trends - User engagement patterns
Inventory Report
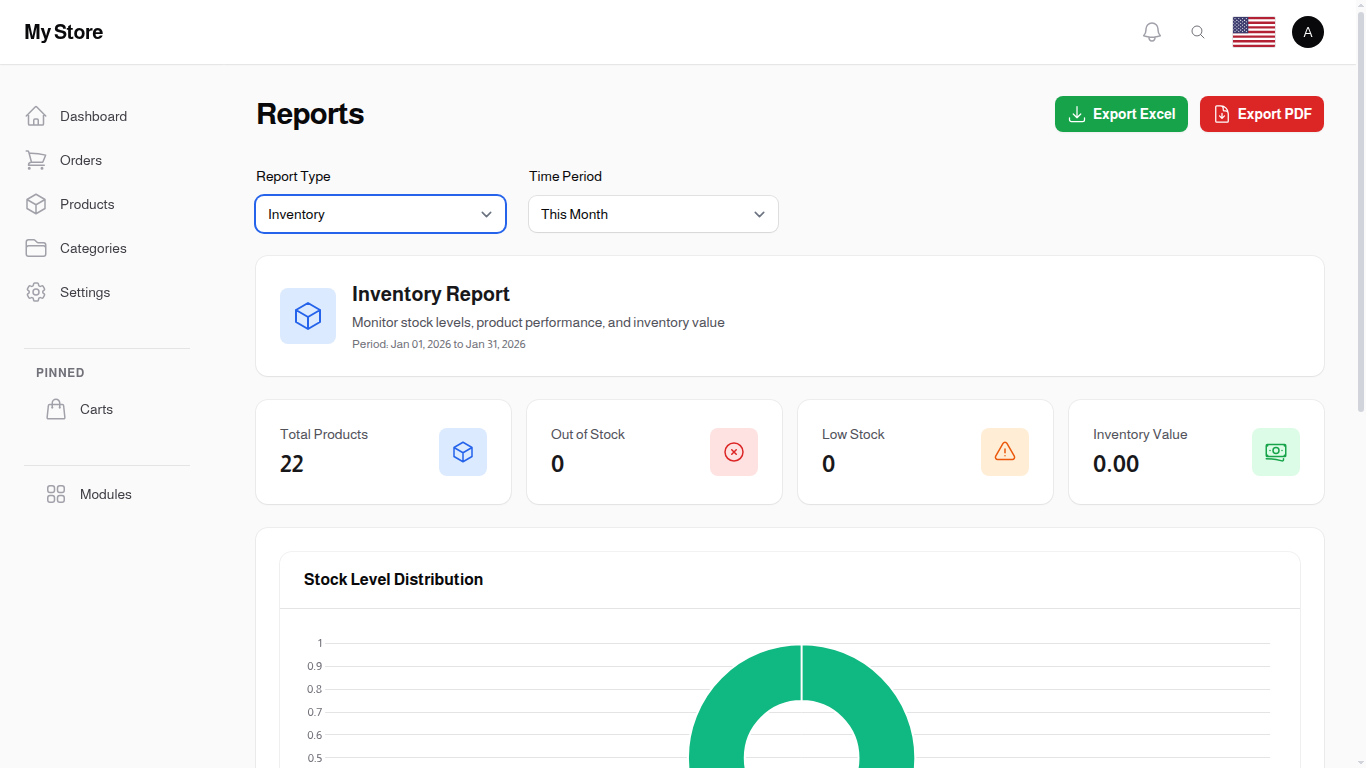
Inventory Report showing stock levels and product performance
The Inventory Report helps you manage your product catalog and stock levels:
Stock Overview: - Total Products: Number of products in catalog - In Stock Products: Products with available inventory - Out of Stock Products: Products needing restocking - Low Stock Alerts: Products below minimum threshold
Product Performance: - Best Sellers: Top products by sales volume - Slow Movers: Products with low sales - Stock Value: Total value of current inventory
Category Analysis: - Products per category - Stock distribution across categories - Category-wise sales performance
Inventory Trends: - Stock level changes over time - Restocking patterns - Seasonal inventory variations
Export Options
The Reports page provides two export formats accessible via header action buttons:
Export Excel
Click the Export Excel button (green button with download icon) to download the current report as an Excel spreadsheet (.xlsx):
Features: - All data tables included in separate sheets - Formatted cells with headers - Ready for further analysis in Excel or Google Sheets - Includes all metrics and detailed data
File Name Format: report_type_YYYYMMDD_YYYYMMDD.xlsx
Example: sales_revenue_report_20251101_20251130.xlsx
Export PDF
Click the Export PDF button (red button with document icon) to download the current report as a PDF document:
Features: - Professional formatted report with your store logo - All charts and tables included - Print-ready layout - Suitable for presentations and archiving - RTL support for Arabic language
File Name Format: report_type_YYYYMMDD_YYYYMMDD.pdf
Example: financial_report_20251101_20251130.pdf
Using Reports Effectively
Compare Time Periods: Run the same report type for different time periods to identify trends. For example, compare this month vs. last month to measure growth.
Regular Monitoring: Schedule regular report reviews (weekly/monthly) to stay informed about your business performance.
Export for Records: Export important reports as PDF for business records, tax purposes, or sharing with stakeholders.
Data-Driven Decisions: Use report insights to make informed decisions about inventory, marketing, and business strategy.
Identify Opportunities: Use the Inventory Report to identify slow-moving products that may need promotions, or use the Sales Report to identify top products worthy of increased marketing focus.
Related Sections
- Analytics - Visitor analytics and website traffic data
- Orders - Detailed order management
- Products - Product catalog management
- User Wallets - Customer wallet management