Product Sales Report
Purpose
The Product Sales report answers one question the general Reports page cannot: which products actually make you money?
A product can sell well and earn you almost nothing, and a product that sells rarely can carry a whole category. This report puts quantity, revenue, cost and profit on the same row so the difference is visible.
Accessing the Product Sales Report
Click Modules → Reports → Product Sales Report
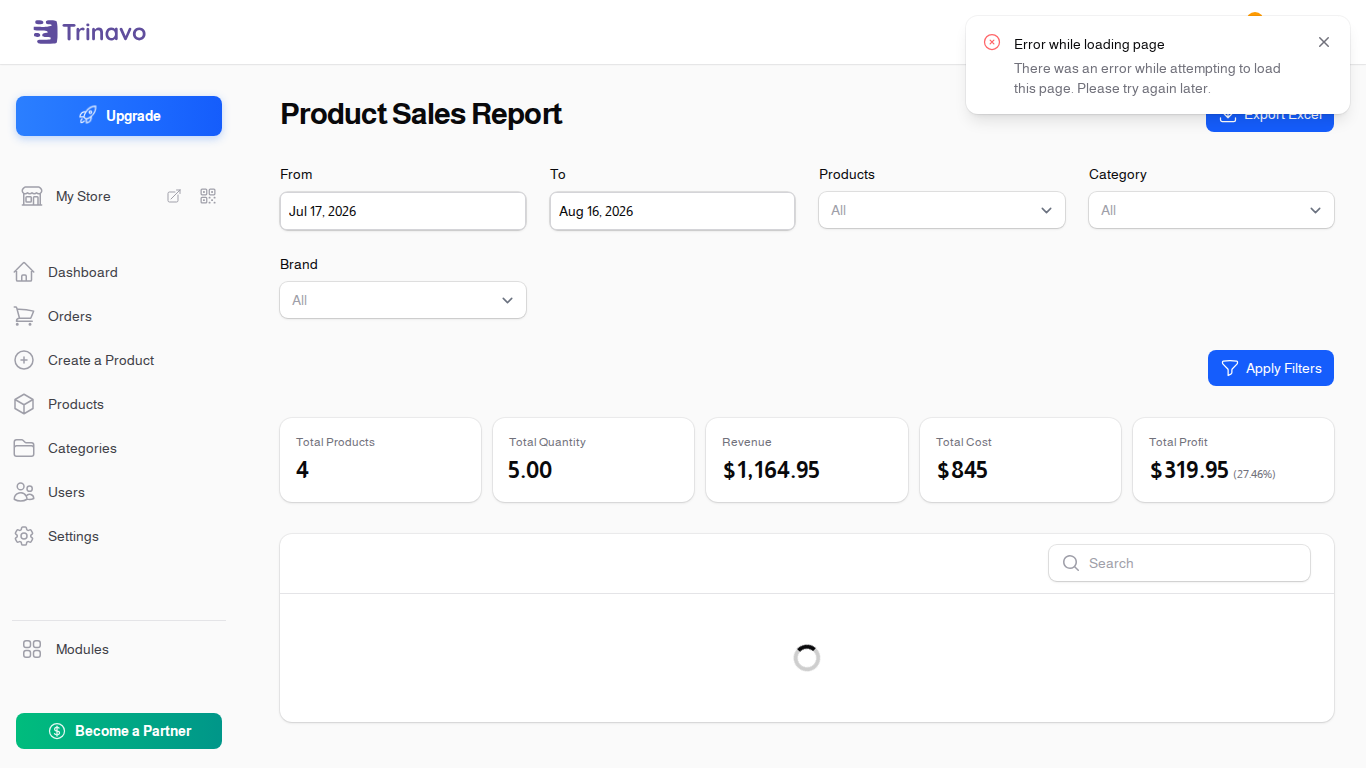
Choosing what to look at
- From and To: the period. Sales are counted by order date
- Products: narrow to specific products, when you want to compare a handful against each other
- Category: everything filed under a category
- Brand: everything from one or more brands
Leave them empty to see the whole catalogue for the period.
Reading the columns
| Column | What it means |
|---|---|
| Item | the product |
| SKU | its stock code |
| Category | where it is filed |
| Brand | its brand |
| Quantity Sold | how many units left you in the period |
| Revenue | what customers paid for them |
| Total Cost | what those units cost you |
| Profit | Revenue less Total Cost |
| Profit Margin | profit as a percentage of revenue |
Cost has to be there for profit to be right
Profit and Profit Margin are only as good as the cost behind them. A product with no cost recorded looks like pure profit, because the store has nothing to subtract.
Cost reaches a product two ways: you set it on the product itself, or it comes from a goods receipt when the stock arrived. If a lot of your catalogue shows a suspiciously perfect margin, that is the thing to check first.
The Financial report on the main Reports page warns you when this is happening across the store.
Related Sections
- Reports - sales, financial, user and inventory reports
- Goods Receipts - where product cost usually comes from
- Products - where cost is set by hand
- Expenses - running costs, which this report does not include